
Link: http://espn.go.com/espn/feature/story/_/id/12331388/the-great-analytics-rankings#
[THE GREAT ANALYTICS RANKINGS in MLB and other sports (by ESPN)]
Link: http://espn.go.com/espn/feature/story/_/id/12331388/the-great-analytics-rankings#
[THE GREAT ANALYTICS RANKINGS in MLB and other sports (by ESPN)]
2015 – The Winners — Information is Beautiful Awards
Download the Twitter app
http://www.hardballtimes.com/a-short-ish-introduction-to-using-r-for-baseball-research/

The article has great examples as well as links to other resources.
[A Short(-ish) Introduction to Using R Packages for Baseball Research, by @billpetti]
This is awesome. I have been looking for game data in the MLB for the 2015 season, and although boxscores are fairly easy to find per day, to get them as one dataset is a lot harder. Yes, you can write a Python script that automatically pulls this data per day, but I found something far easier: SDQL, or sports data query language. Perhaps I have been under a rock for years, but to me this was an exciting find.

It is simple, and gives access to a lot of data in a format you can define yourself. I have a background in data and some SQL, but it really isn’t too hard to figure out by reading the documentation. For example, the following query: “date, game number, team, runs, hits, errors, o:team,o:runs, o:hits, o:errors, attendance, series game, total@season=2015” gives this result:
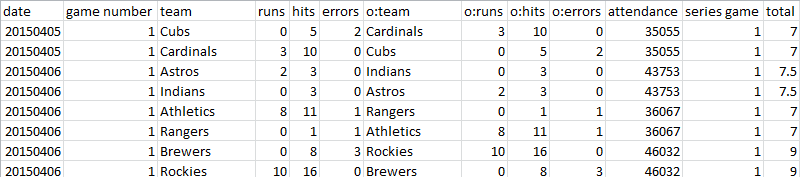
Exactly what I needed!
So thank you @sdql for providing this great tool!
[MLB data through querying on
http://sportsdatabase.com by @sdql]
Again, Vik doesn’t just write about the pro’s and con’s of these two languages, but compares them practically by going through a number of activities side-by-side.
https://www.dataquest.io/blog/python-vs-r/
His conclusions, in short:
· R is more functional, Python is more object-oriented
· R has more data analysis built-ins, Python relies on packages
· Python has “main” packages for data analysis tasks, R has a larger ecosystem of small packages
· R has more statistical support in general
· It’s usually more straightforward to do non-statistical tasks in Python
· There are many parallels between the data analysis workflow in both
PS I forgot to add the link to the previously posted article about Python data visualization tools. It can be found here.
Vik provides brief insight in some Python data visualization libraries, but he does so with practical examples on how the libraries can be used. Good article to get more familiar of options and when to use them.

[Just what I was looking for: Python data viz libraries compared by @vikparuchuri HT@dataelixir]
this looks like fun!
JuanPotato/Legofy · GitHub
http://datajedininja.blogspot.ca/2015/10/web-data-connectors.html?m=1
Download tools and see documentation here: http://community.tableau.com/community/developers/web-data-connectors
[Tableau Web Data Connectors]
