http://datajedininja.blogspot.ca/2015/10/web-data-connectors.html?m=1
Download tools and see documentation here: http://community.tableau.com/community/developers/web-data-connectors
[Tableau Web Data Connectors]
http://datajedininja.blogspot.ca/2015/10/web-data-connectors.html?m=1
Download tools and see documentation here: http://community.tableau.com/community/developers/web-data-connectors
[Tableau Web Data Connectors]
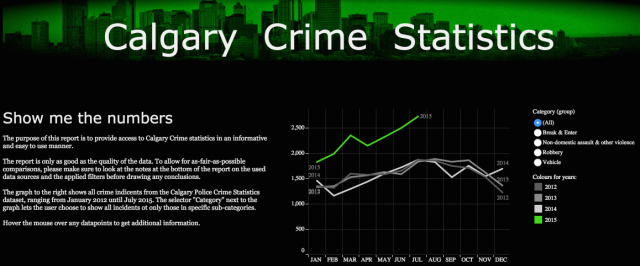
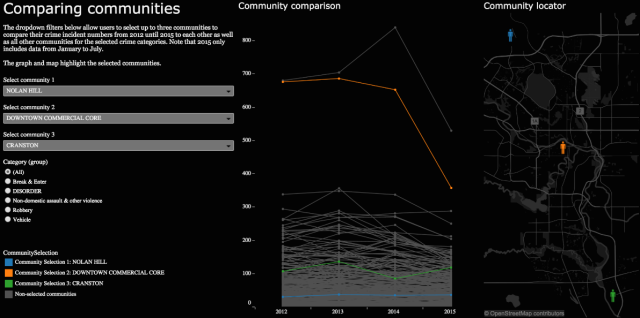
Calgary provides police reports on the city crime statistics, but they are not easily consumed. With Tableau Public I have tried to provide insight in these statistics in the following dashboard.
Although Tableau Public has an embedding function, WordPress doesn’t appear to like it as the result was appalling. So for now, viewing the dashboard works best by going through Tableau website itself, linked above.
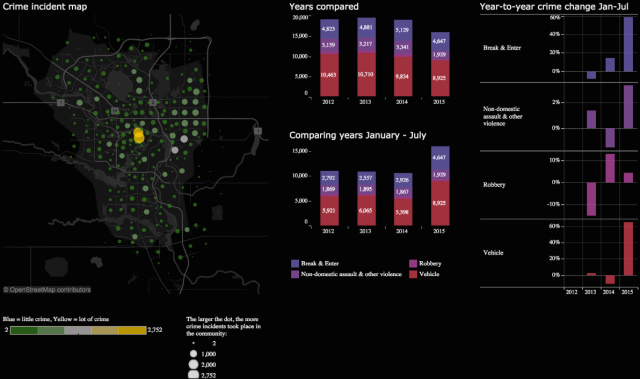
It shows general crime trends, details per community, year and category,
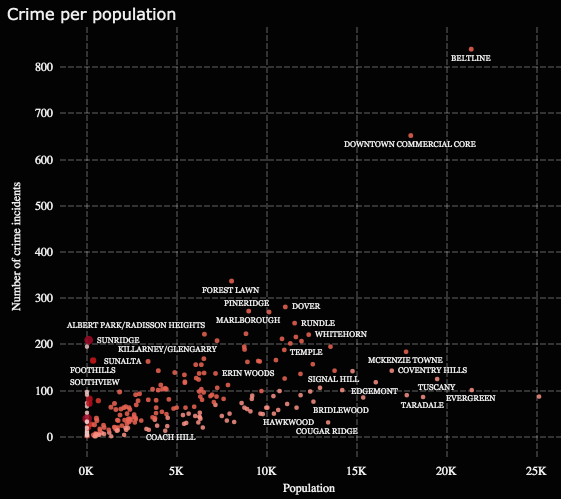
the crime-to-population ratio for communities,
and allows users to compare up to three communities:
I am happy that the city makes this data available, but I would hope they did so in a more readable and usable format. I hope this dashboard will help exposing this data to the people in Calgary.
The 14 Best Data Visualization Tools
[catergory tools]
datablick.com/2015/02/04/fast-and-fabulous-custom-maps-using-mapbox-in-tableau
Download the official Twitter app here
Sent from my iPad
 |
Ben Jones (@DataRemixed) |
| 2015-02-04, 11:38 A 1hr recording of my “Avoiding Data Pitfalls” webinar with @DataScienceCtrl is available vimeo.com/118643819 pic.twitter.com/eaZxNQHu4d |
|
Download the official Twitter app here
Download the official Twitter app here